Process Infographic Design Service

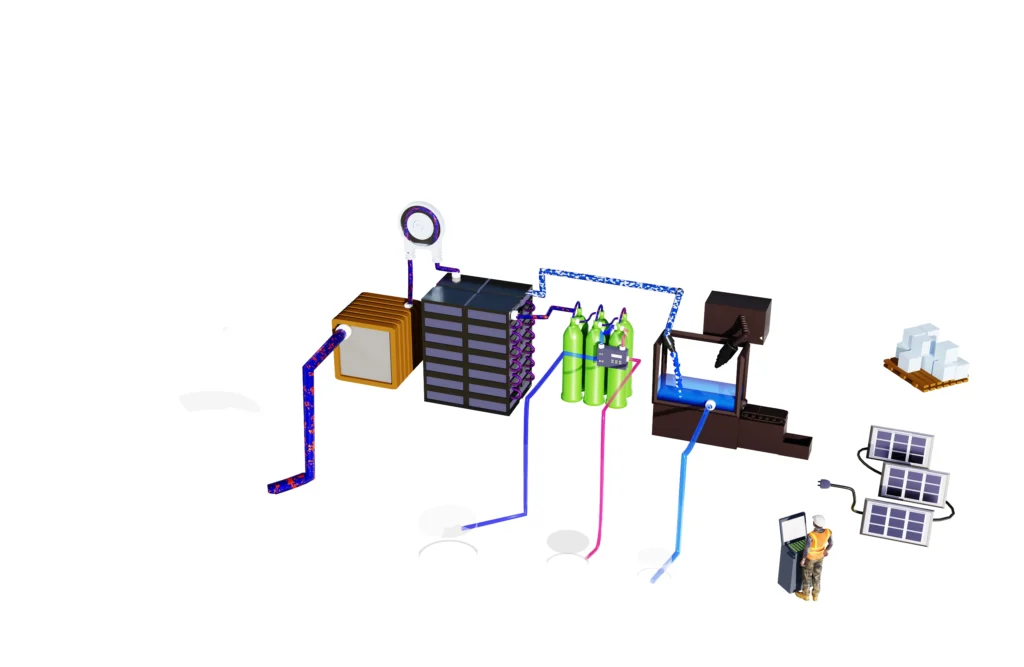
A process infographic transforms a complex workflow into a single, immediately understandable visual. Whether you need to explain an industrial process, a scientific method, or a piece of mobile equipment, a well-designed infographic communicates what a datasheet cannot. At Science Design Services, we combine 3D modelling, technical illustration, and graphic design to produce infographics that are both accurate and visually compelling.

Contact us today to learn more about our services and to discuss your next project.

A process infographic depicting a 3D model of a lithium battery processing facility mounten on a truck, demonstrating its innovative and portable nature.

How We Created This Process Infographic


This infographic was commissioned to show how a lithium battery processing facility could be mounted on a truck bed — making the entire system portable and field-deployable. The client supplied a simple flow diagram identifying the key equipment and process stages.

Our workflow:

 3D modelling in Blender

Each piece of equipment was modelled and textured individually, giving the client flexibility to update or repurpose individual assets later.

Rendering in layers

elements were rendered separately, enabling fine control over lighting, shadows, and compositing

Compositing in Photoshop

Rendered passes were combined and atmospheric effects added.

Final graphics in Illustrator

Callouts, labels, flow arrows, and typography were applied in vector format for print-ready resolution.

Process infographic creation showing design of key process components in 3d

Equipment

Modelled and textured in Blender.

Elements were rendered in layers to allow flexibility.

Process

A video showing how the image was built up in layers and stages. This approach allows the greatest flexibility to introduce changes and adjustments.

Why Choose a 3D Process Infographic?

Flat diagrams and flowcharts are fast to produce, but they often fail to convey spatial relationships, equipment scale, or the physical reality of a process. A 3D process infographic solves this by:

  • Showing equipment in realistic context
  • Communicating scale and physical layout at a glance
  • Making technical content accessible to non-specialist audiences
  • Supporting marketing, investor decks, grant applications, and training materials

Frequently Asked Questions

What do I need to provide to get started?

A flow diagram, P&ID, sketch, or written description of the process is enough to begin. We will ask follow-up questions to clarify equipment, labelling requirements, and intended use.

Can the infographic be updated if the process changes?

Yes. Because all assets are kept as editable source files (Blender, Photoshop, Illustrator), changes to individual components can be made without rebuilding the entire image.

What file formats will I receive?

We deliver high-resolution print-ready files (PDF, PNG, TIFF) and web-optimised versions. Source files can be provided on request.

Do you handle animation as well as static infographics?

Yes — see our Technical Animation Service for motion-based alternatives to static infographics.

Animations, powerpoints

Privacy Overview

This website uses cookies so that we can provide you with the best user experience possible. Cookie information is stored in your browser and performs functions such as recognising you when you return to our website and helping our team to understand which sections of the website you find most interesting and useful.